Markets, Dogecoin, DOGE, market analysis, News While historically linked to significant price increases, the golden cross is not a reliable standalone indicator.
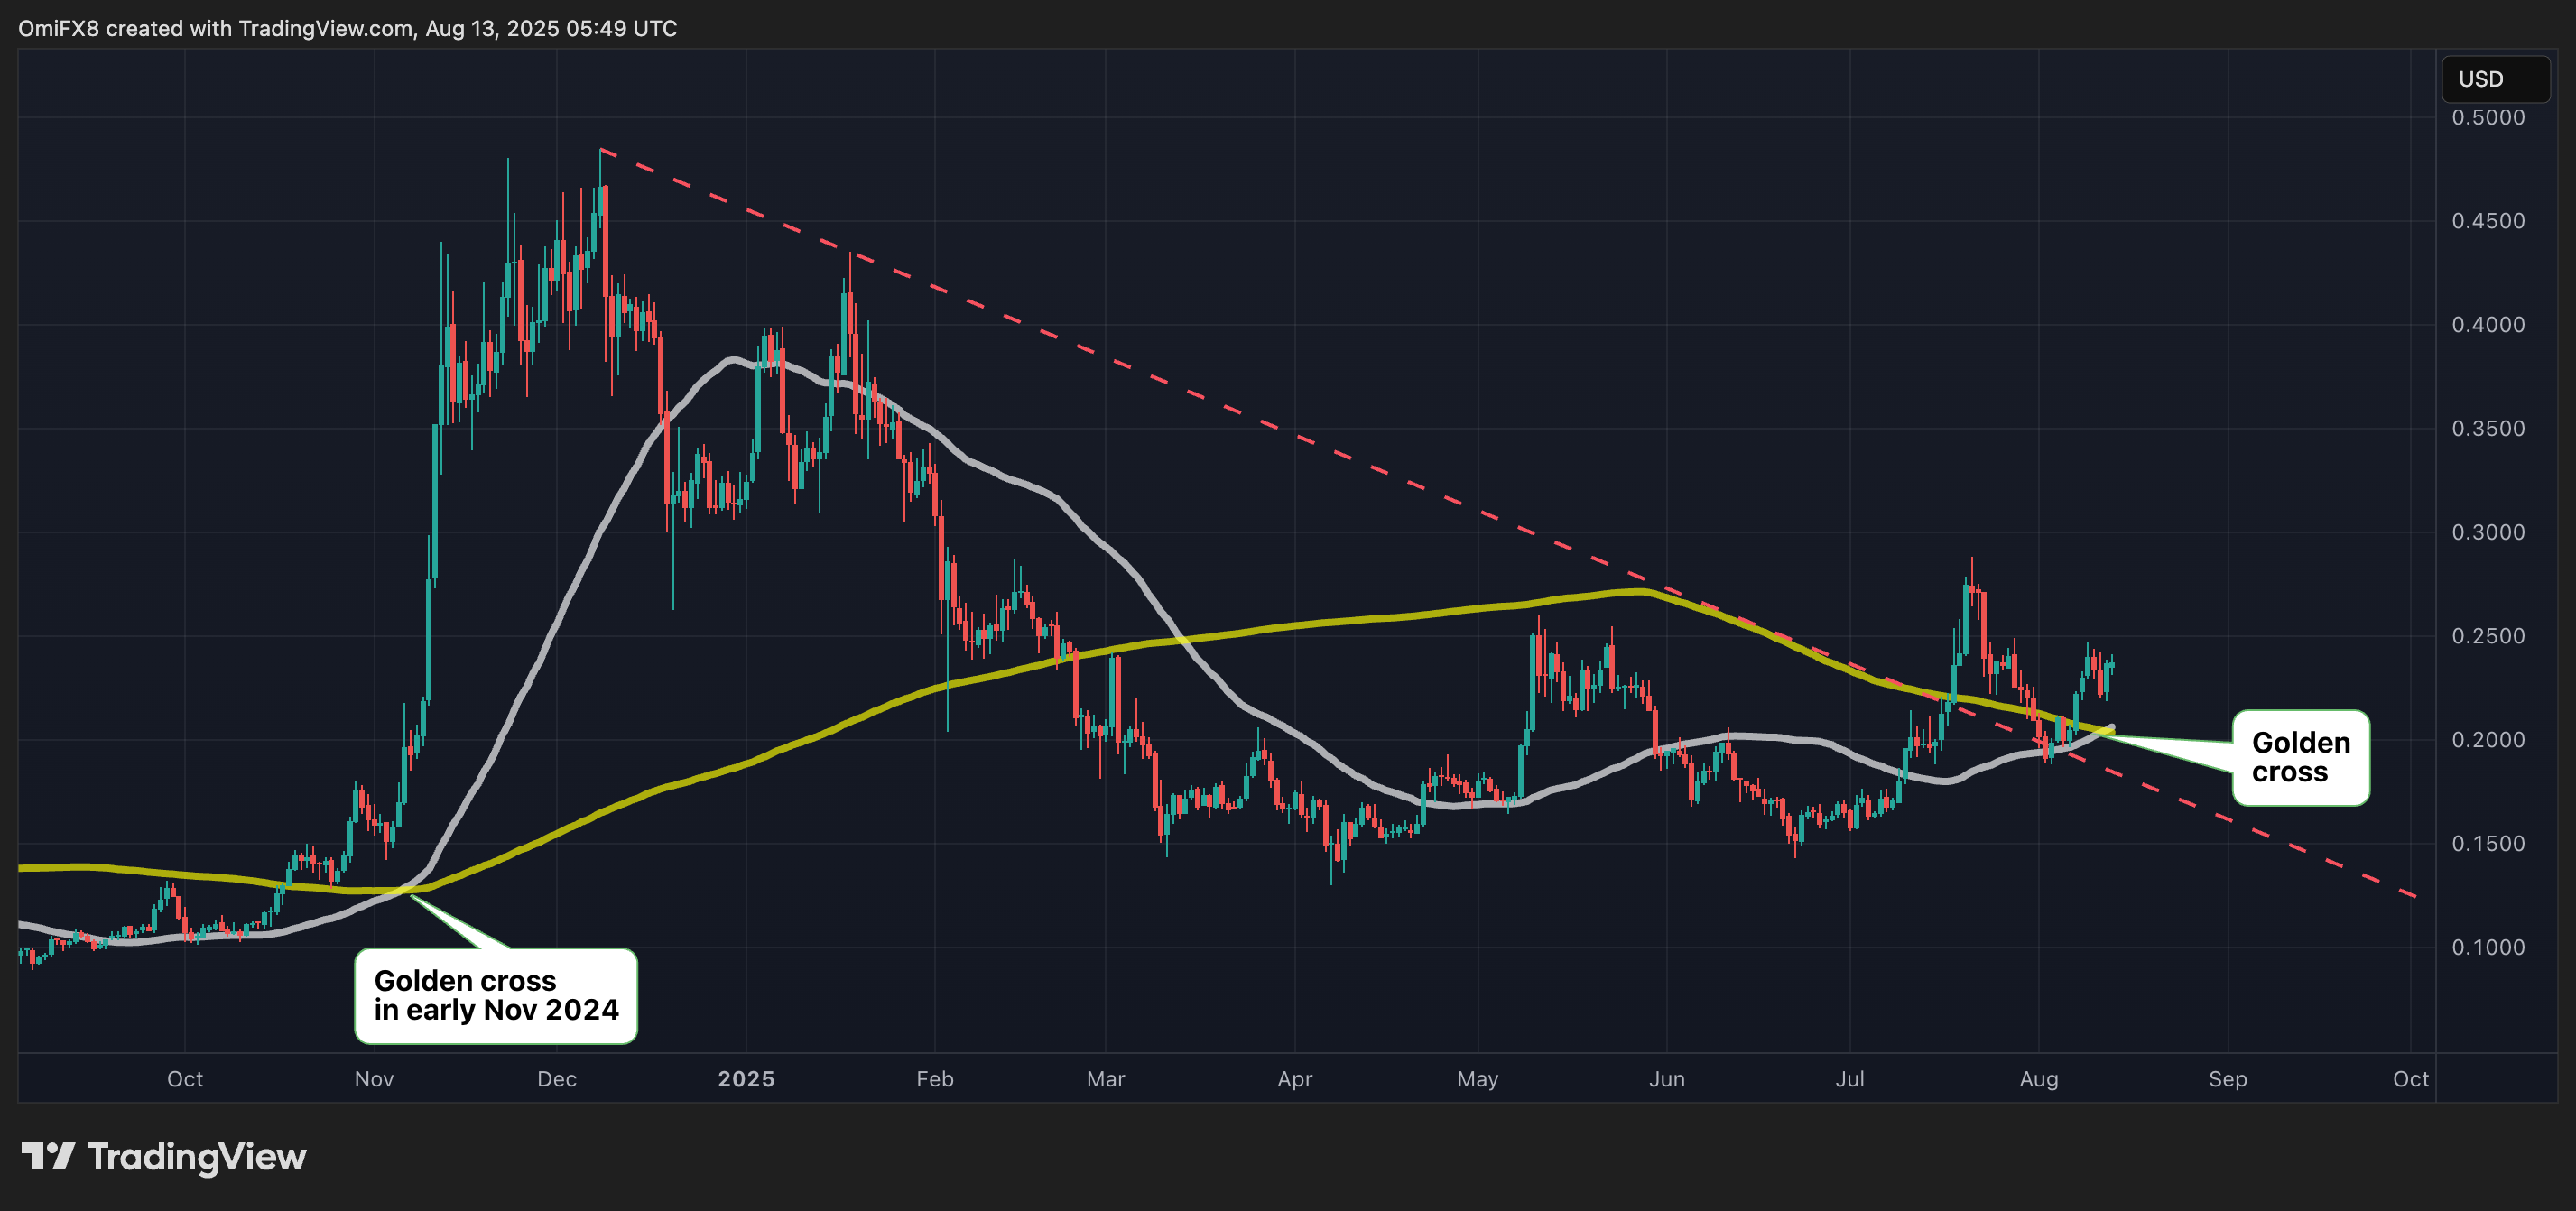
Meme cryptocurrencies may soon heat up as their leader, dogecoin (DOGE), has formed a golden cross, hinting at a major price surge ahead.
A golden cross occurs when the 50-day simple moving average (SMA) of an asset’s price moves above the 200-day SMA. The crossover indicates that the short-term momentum is now outperforming the longer trajectory, with the potential to evolve into a major bull run.
Dogecoin’s averages crossed bullish early today. While the golden cross is seen as a positive indicator, it has a mixed record of predicting trends in most markets, including equities, bitcoin and DOGE. That makes it unreliable as a standalone indicator.

That said, most of DOGE’s previous big moves unfolded with the appearance of the golden cross. For instance, prices surged over 130% to 46 cents in four weeks following the occurrence of the golden cross on Nov. 6, 2024. Prices surged 25% in four weeks after the averages crossed bullish on Nov. 22, 2023.
Similarly, a golden cross happened in early November 2020, marking the onset of a major four-month bull run that saw prices rally over 1,000% in four months.
Let’s see if history repeats itself.
Read more: Sharp 7% Drop Sends DOGE Toward 22-Cents Support on High-Volume Selloff
CoinDesk: Bitcoin, Ethereum, Crypto News and Price Data Read More
